


NPK fertilizer plant project report: what a bankable study has to prove
An NPK fertilizer plant project report is read by people with money at stake: bank credit committees, equity investors, EPC contractors, and the engineers who will run the plant. They test three things. Can the plant be built for the stated cost, can it hold the capacity the promoter claims, and can the fertilizer be sold at a price that covers raw materials, energy, and debt service?
Reports that stall at the financing stage carry the same gaps: a vague process route, a missing raw material and nutrient balance, and an equipment list with no performance guarantee behind it.
What a credible NPK fertilizer plant project report contains
The reports that survive due diligence follow a common skeleton, close to the feasibility study structure UNIDO set out for industrial projects.
| Chapter | What it has to prove |
|---|---|
| Market and demand | Demand by crop, import parity price, competing capacity |
| Technology | Route chosen, feedstock fit, mass and nutrient balance |
| Configuration | Capacity, grades, layout, storage |
| Equipment | Sizes, drive power, guarantee per unit |
| Cost | Capital items, exclusions, raw material and energy cost |
| Financials | Cash flow, IRR, payback, debt service cover, sensitivity |
| Compliance and risk | Registration, permits, safety, risk register |
Two rules matter more than the table. The technical and financial chapters have to be built from one dataset, because a small error in assumed nutrient recovery moves the projected return further than any financing term. Output also has to be priced against imports, since buyers can usually choose imported fertilizer.
The four numbers that decide the project
Almost every NPK fertilizer plant project report that disappoints was optimistic in one of these lines.
- Raw material cost per ton of finished fertilizer, the largest cash cost on most lines.
- Recovery, meaning on-spec product per ton of nutrients fed, since off-spec recycle hides as cost.
- First-year utilization, rarely above 60 to 70 percent.
- Realized price against import parity, after distribution margin and credit terms.
The NPK fertilizer manufacturing process: what the route choice decides
The NPK fertilizer manufacturing process you choose fixes most of the remaining decisions in the report: which raw materials can be used, how much steam and fuel the plant burns, how the granules store, and how much capital sits in the equipment train. Commercial plants use several routes, each winning in a particular formula range.
| Route | How it works | Where it fits | Main drawback |
|---|---|---|---|
| Steam-assisted drum | Powder tumbles in a drum with steam, water, and recycled fines | Complex NPK grades, 5 to 30 t/h | Needs dryer, boiler, dust control |
| Urea melt or slurry | A melt sprayed onto the rolling bed acts as binder | High-nitrogen grades, large plants | Urea is heat sensitive |
| Compaction | Roll press squeezes dry powder into sheets that are crushed and screened | Formulas that cannot take water or heat | Flatter granules, less flexibility |
| Disc or pan | An inclined pan rolls moist powder into spheres | Small and medium lines, organic blends | Operator dependent, high fines recirculation |
| Extrusion | Screw or roller press pushes mix through dies | Small capacity, local blending | Cylindrical pellets, limited output |
| Bulk blending | Granular urea, DAP, and MOP tumbled, no granulation | Low capital, flexible formulas | Segregation in transport |
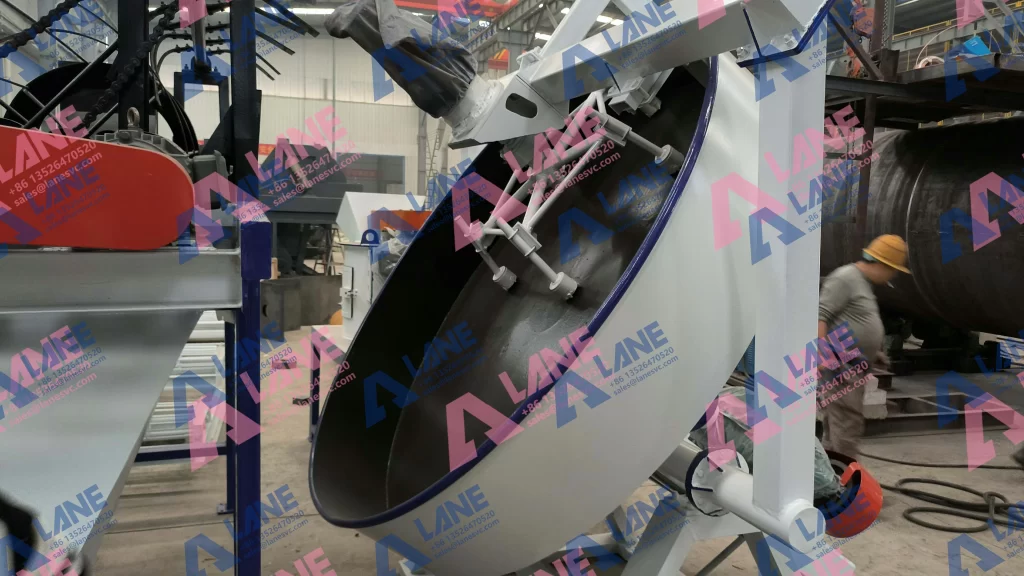
Inside a steam-assisted drum granulation line
The steps below repeat in almost every NPK fertilizer manufacturing process built around a rotary drum.
- Reception and crushing reduce lumpy urea, DAP, or MOP to a workable size.
- Batching weighs each material to the formula, typically within about one percent of target, because a drifting scale changes the grade the buyer pays for.
- Mixing in a twin-shaft paddle mixer sets granule uniformity.
- Granulation injects steam and water into a rolling bed, with material temperature usually between 60 and 90 degrees Celsius.
- Drying brings moisture down to one to two percent. Urea melts near 130 degrees Celsius and decomposes not far above 150, so dryer temperature and residence time need control.
- Cooling brings product near ambient before coating and bagging. Bagging warm fertilizer causes caking in the warehouse.
- Coating applies anti-caking oil, wax, or powder. Screening then splits product, oversize, and fines, and the recycle ratio shows whether a supplier understands the duty.
- Packing and covered storage complete the flow.
Grades and raw materials
An NPK grade is three numbers for nitrogen, available phosphate, and soluble potash, so 15-15-15 carries 15 percent of each nutrient and 20-10-10 favors nitrogen for a different soil and crop. Soil tests and crop demand decide the grade. Nutrient sources are commodities: urea at 46-0-0, ammonium sulfate at 21-0-0, DAP at 18-46-0, MAP at 11-52-0, muriate of potash at 0-0-60, and sulfate of potash at 0-0-50. Limestone, dolomite, or clay brings a batch to weight, and chloride-sensitive crops push the formula toward sulfate of potash.
Two market shifts are worth building into the demand chapter. Nutrient demand is expanding in Sub-Saharan Africa and South Asia, where new blending and granulation capacity goes up close to the farm gate, while nitrate handling and dust rules tighten in Europe and North America. Both shifts change which grades and which capacity make sense.
Equipment selection for the NPK fertilizer production line
A complete NPK fertilizer production line is a materials handling plant as much as a chemical one. Most startup problems trace back to conveying, weighing, and moisture rather than to the granulator itself.
| Unit | Job | Specification to fix |
|---|---|---|
| Crusher | Reduce lumpy feedstock | Feed size, throughput, wear material |
| Batching | Weigh each material to formula | Hoppers, scale type, accuracy |
| Mixer | Blend before granulation | Mixing time, paddle design, liner |
| Rotary drum granulator | Build 2 to 4 mm granules | Drum size, drive power, steam and water points |
| Dryer and furnace | Cut moisture to 1 to 2 percent | Fuel type, air temperature control, residence time |
| Rotary cooler | Bring product near ambient | Cooling air volume, outlet temperature |
| Coating drum | Apply anti-caking oil or powder | Spray system, dosing accuracy |
| Screen | Split product, oversize, fines | Mesh, capacity margin, dust enclosure |
| Recycle crusher | Return oversize to circuit | Worst-case oversize rate |
| Packing machine | Fill 25 to 50 kg bags on weight | Weighing accuracy, bag type, bags per hour |
| Dust collection and controls | Capture dust, hold the formula | Capture points, filter area, PLC recipes |
Utilities deserve their own table in an NPK fertilizer plant project report: steam, installed power, water, dryer fuel, and compressed air. Ask for consumption at the exact line size and grade, then convert it to cost per ton. A capacity figure without a utility table is not a technical offer.
One common configuration is worth costing early. A 10 t/h line running two grades, with batching on belt scales, a dryer sized for the wettest feedstock of the year, and packing in 25 or 50 kg bags, still has to be built up line by line, because the dryer, the boiler, and the storage building are where estimates drift.
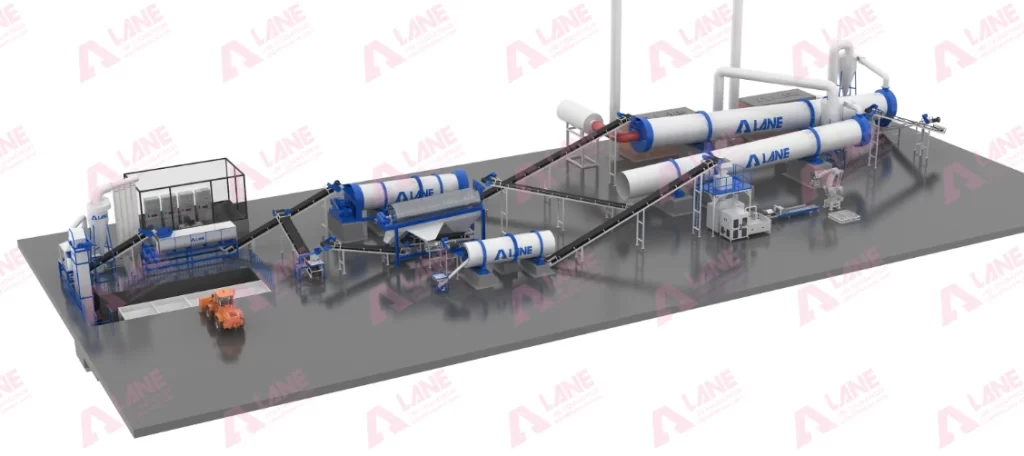
What separates a stable line from a troublesome one
Details that are cheap at the design stage and painful to retrofit: weighing accuracy with scheduled calibration, online moisture measurement instead of hand samples, dryer margin for the wet season, variable frequency drives on drum and dryer, and screening capacity with margin, because undersized screens throttle the plant.
What drives project cost, and how to stress test it
The cost chapter of an NPK fertilizer plant project report is where most of the argument happens. A supplier quotation covers the equipment train and little else. The project also carries civil works and steel, buildings, electrical supply, boilers, water supply, erection and commissioning, spares, contingency, and working capital. Capacity, automation, and the number of grades one NPK fertilizer production line must handle drive the equipment share of that budget.
Working capital is the line promoters underestimate most often, because an NPK plant holds urea, phosphate, and potash inventory in a market where prices move. Thirty to sixty days of feedstock, plus finished goods and distributor credit, adds a sum no quotation shows. The NPK fertilizer manufacturing process sets the energy demand, and feedstock dominates the rest.
Stress tests a lender will ask for
- Feedstock prices up 20 percent with product price unchanged.
- Product price down 10 percent against import parity.
- Utilization at 60 percent in year one and 80 percent in year two.
- Currency movement where feedstock or debt is denominated differently from revenue.
- A 30-day stoppage from a dryer, boiler, or crusher failure.
Schedule, permits, and compliance
A turnkey line of 5 to 20 t/h usually runs 9 to 18 months from contract signature to performance test, with engineering, fabrication, shipping, erection, and commissioning as the main phases. Permitting, land, and finance usually take longer than fabrication, so start them before the equipment order.
The compliance section of an NPK fertilizer plant project report should name the rules for the destination market and confirm product registration with the regulator.
- Product rules. National control regimes set which grades may be sold and how they are labeled, such as India’s Fertiliser (Control) Order. The EU Fertilising Products Regulation (EU) 2019/1009 governs fertilizers sold in Europe, and ISO 8157 fixes the vocabulary for fertilizers and soil conditioners.
- Management systems. ISO 9001, ISO 45001, and ISO 14001, which appear on lender and buyer checklists.
- Machinery safety. CE marking under Regulation (EU) 2023/1230, which replaced the Machinery Directive 2006/42/EC, and machine guarding under OSHA 29 CFR 1910 Subpart O.
- Dust, fire, and nitrates. NFPA 652 and NFPA 654 for combustible dust, OSHA 29 CFR 1910.109(i) and the Seveso III Directive 2012/18/EU for nitrate storage, plus local fire code requirements.
- Environmental permits. Air permits for dryers and boilers, water discharge limits, and waste handling.
For market data, use published sources: IFA for production and consumption statistics, FAO’s FAOSTAT nutrient series, USGS Mineral Commodity Summaries for ammonia, phosphate rock, and potash, and AfricaFertilizer.org for African data. Agronomic fit should follow 4R Nutrient Stewardship, the right source at the right rate, time, and place.
Keeping the line running: maintenance and quality control
Wear parts consume the maintenance budget on an NPK fertilizer production line: crusher hammers, granulator liners and scrapers, mixer paddles, dryer lifters, screen mesh, coating nozzles, and bagging jaws. A critical spares list with lead times, held partly on site and partly at a regional warehouse, keeps a remote plant running through a breakdown. Control points repeat across every NPK fertilizer manufacturing process, and moisture, temperature, and particle size matter most.
Quality control pays back quickly, and it is one of the cheapest lines in an NPK fertilizer plant project report. Standard tests cover nitrogen by Kjeldahl or combustion analysis, phosphate by spectrophotometry, potash by flame photometry, plus moisture, granule size, crushing strength, and caking after storage. Calibrate belt scales against check weights on a fixed schedule.
Choosing the supplier and the performance guarantee
A credible supplier provides the mass and nutrient balance, the process flow diagram, a general arrangement drawing, the utility consumption table, the equipment list with weights and motor ratings, and a performance guarantee stating capacity, granule size, and moisture for a named grade at named feed specifications. Ask whether core units such as the granulator, dryer, and cooler are manufactured in house, because that decides who is accountable if the NPK fertilizer production line misses its guarantee.
Reference plants matter more than catalog pages. Ask for three running plants of similar capacity and formula, then ask those operators what broke in the first year. Confirm in writing who supplies civil works, the boiler, electrical, cabling, loaders, and commissioning, and what happens at the performance test if guaranteed capacity is not reached. The mass balance and utility table also feed the NPK fertilizer plant project report, so request them before a purchase order.
Warning signs: a capacity figure quoted in annual tons with no hours per year, no mass balance, no spare parts list with prices, no contactable references, a payment schedule that front-loads the contract before commissioning, and a price that changes after the deposit.
FAQ
How much does it cost to build an NPK fertilizer plant?
Cost scales with capacity, automation, and scope. Build the estimate from an equipment list, then add utility, civil, erection, contingency, and working capital.
What raw materials are needed to make NPK fertilizer?
The mix depends on the grade and on the NPK fertilizer manufacturing process you select. Typical sources are urea, ammonium sulfate, DAP or MAP, potash, and superphosphate, with limestone or clay as filler.
What is the difference between bulk blending and granulated NPK?
Bulk blending mixes granular materials without granulation, so capital is low and formulas stay flexible, but the blend can segregate in handling. Granulation, the more demanding NPK fertilizer manufacturing process, bonds nutrients into uniform particles that store and spread better.
How long does it take to build an NPK fertilizer plant?
A turnkey NPK fertilizer production line commonly takes 9 to 18 months from contract to performance test. Permitting, land, and finance usually take longer, so start them first.
How much land and power does an NPK fertilizer plant need?
Land is set by storage rather than by machinery. Power, boiler, water, and fuel loads should come from the supplier’s utility table for your line and grade.
Can one NPK fertilizer production line make more than one grade?
Yes, within limits. A grade change means a new recipe and often different drying settings, plus time for cleaning and changeover. Flexible lines need more hoppers and dryer margin.
Is an NPK fertilizer plant profitable?
Profitability comes from feedstock cost per ton, nutrient recovery, first-year utilization, and realized price against imports, not from headline capacity.
Why does NPK fertilizer cake in storage?
Residual moisture, high bagging temperature, uneven granule size, and humid storage cause caking, and hygroscopic materials such as urea make it worse. Cooling before coating and drying to specification solve most of it.
Next step
If you are assembling an NPK fertilizer plant project report, the fastest way to close the technical chapter is the mass balance, utility table, and equipment list for your configuration. LANE Machinery prepares those documents for compound and organic fertilizer projects.

Send a message to us